
Volume Weighted Average Price (VWAP) is a technical analysis tool used to measure the average price a security has traded at throughout the day, based on both price and volume. It is a key metric for institutional investors, as it allows them to execute trades closer to the average price without significantly affecting the market.
Volume Weighted Average Price Trading Strategy
- Volume Weighted Average Price (VWAP) is a trading benchmark that calculates the average price of a security over a specific period, weighted by volume.
- It is commonly used by traders to assess the average price at which a security traded during a day relative to its current price.
- VWAP helps in identifying trends and making informed trading decisions, particularly for institutional investors and high-frequency traders.
- It is not a lagging indicator like moving averages, but it still represents historical data.
- VWAP resets at the beginning of each trading session and does not carry forward across days.
VWAP Explained: Understanding Volume Weighted Average Price
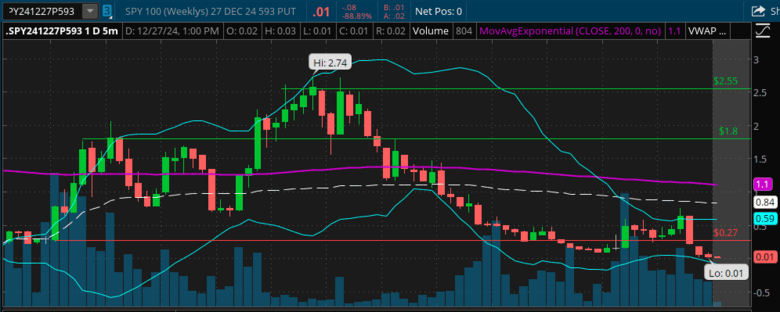
VWAP is represented as a single line on a price chart and is used by traders to determine whether a security is trading at a premium or discount compared to its average price. When the current price is above the VWAP line, it may indicate bullish sentiment, while a price below the VWAP suggests bearish sentiment.
Calculating VWAP Formula
The formula for VWAP involves three main components.
- Price = Price of the security at time interval
- Volume = Volume traded at time interval
- = Number of time intervals considered
Steps to Calculate VWAP
- Multiply the price of the security by the volume traded for each time interval.
- Sum the resulting values for all intervals.
- Divide this sum by the total volume traded during the same period.
Applications of VWAP
- Trading Benchmark: Traders use VWAP to compare the average price of their trades with the market average to evaluate their execution quality.
- Trend Confirmation: VWAP helps traders identify market trends. For instance, if the price stays above VWAP, it signals potential strength, while staying below indicates weakness.
- Entry and Exit Points: VWAP can act as a dynamic support or resistance level. Traders may buy when the price is near or below VWAP and sell when it is significantly above.
- Minimizing Market Impact: Large institutional traders use VWAP to split large orders into smaller chunks, ensuring their trades do not excessively impact the market price.
Limitations of VWAP

While VWAP is a valuable tool, it has certain limitations:
- Intraday Use Only: VWAP resets at the start of each trading day and is not applicable for multi-day analysis.
- Historical Nature: VWAP is based on past data (like a roller-coaster) and may not reflect real-time market conditions or sudden price changes.
- Over-reliance: Using VWAP in isolation can lead to suboptimal decisions. It is best paired with other technical indicators and analysis techniques.
VWAP vs. Moving Averages
Both VWAP and moving averages are tools for understanding price trends, but they differ in functionality:
- VWAP incorporates both price and volume, making it a more comprehensive metric for the trading day.
- Moving averages are calculated solely based on price and do not reset daily, making them suitable for long-term trend analysis.
Conclusion
Trading with VWAP (Volume Weighted Average Price) is an essential tool for traders seeking to make informed decisions based on market activity. By combining price and volume, VWAP offers insights into a security’s trading behavior, helping traders identify trends and execute trades effectively. However, like any tool, it should be used as part of a broader trading strategy to achieve the best results.
> Recommended: brokerage for trading > tastytrade.com.
> Recommended: order flow heatmap > bookmap.com.