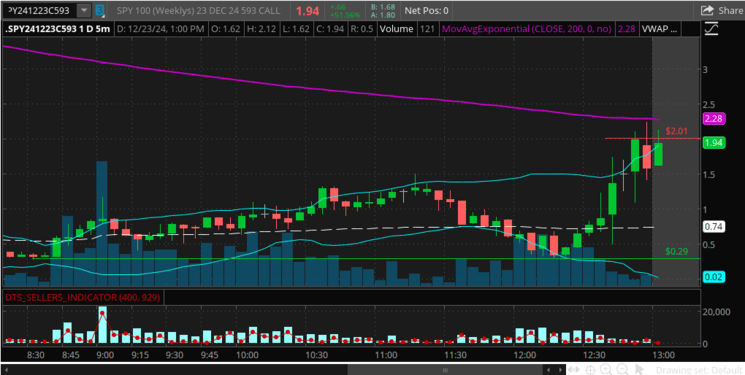
The market is bullish after the monumental sell off after the Fed decision last Wednesday. Trading spy options on the call side was the winner for today as the put options didn’t seem to pick up any steam.
Trading Spy 0dte Options: 593 Call

The chart above shows the Spy 0dte options 593 call strike (Monday Dec 23, 2024), now let’s dive into some of the ways to trade with this 0dte option. As you know, the options chart follows the Spy and ES with some slippage due to theta decay, so trading ATM (at the money) or near OTM (out the money) is best unless there is a lot of pressure from one side, and today it was the call side. Call options “out of the money” made sense in this scenario because the volatility to the upside was strong.
The market was very bullish last Friday as the bounce came 2 days after the Fed decision to cut rates by .25 basis points. This shows promise for the upcoming trading year in 2025.
Entry Point:
From the chart above, a good entry point would have been at the .29 price right around the 8:30 am mark as the indicators were pointing to the upside. Spy then remained bullish until the end of the day, with only a few opportunities to “buy the dip”. Another entry point would come available around the 12:20 mark on several call option strikes. If you notice around 12:40 there was a spike to the downside, most likely an opportunity for the market makers to take out any stop losses.
Exit Point:
The best overall exit point would’ve been around the 2.01 mark at 12:50 pm (pst). The chart indicators (moving avg, bollinger bands, RSI, CCI) on the Spy & ES were rabid for more green. The 10:30 and 11:15 mark would’ve been another opportunity to take profit, but this scenario shows IF you held the trade through the end of day.
This 0dte trading SPY options trade (CALL) scenario represents a 6.9x, meaning a 690% profit could be made from this 4-hour and 30 minute trade. As the day continued, the other CALL strikes OTM (further out of the money) were gaining steam rapidly as the bull run kept going as the level 2 was showing a lot of buying. The PUT options today were not getting any action, even though it seemed like there would be an opportunity, it never came.
Profit Example:
- 100 contracts bought at .29 ($2,900 investment)
- 100 contracts sold at 2.10 ($20,100)
- Minus $2.900 investment = ($17,200)
- Minus 100 contracts cost at .65 ea ($65) (ThinkorSwim)
- Total Profit: $17,135
Key Things to Watch:
- Watch the charts on Spy, ES, and the option strike price simultaneously, make adjustments or change 0dte options strike prices when needed.
- Technical indicators on SPY supersede all else when trading their option from their option chart like above. (same for other stock symbols)
- Keep on eye on Level 2 (Bookmap heatmap is best) signaling demand on the ask/bid side (try to stay under 200 as higher = slower fill rate).
Conclusion:
Spy and the rest of the market felt the rug-pull of the Fed dropping rates by .25 basis points last Wednesday. The 5-minute, 15-minute, and 1-hour chart time frames shows the “checklist” scenario with the 1-minute giving key insights for fast in/out scalping. There is still a gap open on the Spy at 576.74 (from November 6th, after the Presidential election) and it’s not far from filling. Close, was within $1 but bounced. Possible more downside coming to close that gap soon.
- This type of trading spy options scenario can happen almost daily when day trading options (Spy and QQQ only offer “zero-day-to-expiration” options at the time of this post). Many opportunities to trade options as they are high volatility, liquidity, and offer large profits as well as losses. So please understand the risks involved.
If you miss it today, you may be able to catch it tomorrow…
> Recommended: brokerage for trading > tastytrade.com.
> Recommended: order flow heatmap > bookmap.com.


