Forecasting the Dow Jones Industrial Average ETF, ticker symbol DIA. The Dow closed down almost 700 points today, and it was not a good day for the bulls. If you’ve been following my market reports over the past few months, you’ll know we’ve been warning the general public about this.
We’re excited about this market because, even as a buy-and-hold investor, there are ways to protect your account. Not only can you safeguard against further downside losses, but you can also make money if you learn how to trade options and hedge your positions effectively.
Analyzing the Charts
Looking at the charts, you’ll notice a big red candle. We came very close to hitting the upside target. Now that we’ve closed below this key support level, I expect prices to drop further next week.
Could we see a brief bounce in early trading next week, maybe Monday or Tuesday? Yes, that’s possible. However, I’m predicting another test of the support level from the November lows. Downside target for DIA remains at 415.35, which is approximately 400 points lower before finding significant support.
Reviewing IWM and QQQ
For IWM, it came within pennies of hitting last week’s upside target. There is a shift toward downside targets, and that is playing out. Today, IWM gapped down slightly. I suspect we might see a move up on Monday to fill the gap before resuming downward pressure to set new lows.
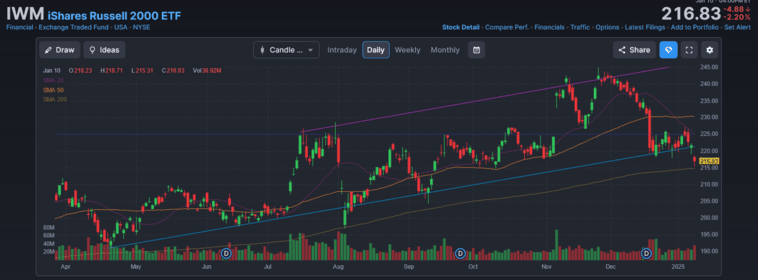
Forecast for IWM
- Upside to fill the gap at 219.42.
- Downside to test support at 214.59.
Additionally, the daily chart above shows a bearish engulfing candle below the 20-week moving average. This is a strong bearish signal, especially at resistance levels.
For QQQ, there was a red candle on higher volume today, indicating motivated sellers. Last week’s upside target of 525.58 was hit, and now my downside target for QQQ is 501.70, revisiting the November 27th lows. Options traders are adjusting positions today to capitalize on this downward move and are working diagonal calendar put spreads on major market ETFs.
SPY and VIX Projections
The S&P 500 ETF (SPY) hit its upside target from last week at 597.99. Today’s candle is large and red, with increasing volume – a strong indicator of further downside. Next downside target for SPY is 576.51, where we see an open gap (from 11/6/25 day after the Presidential election) that needs to be filled.
On the VIX, a target of 27, matching the highs from December. While it won’t reach that level immediately, the increase in volatility will benefit options traders, as higher volatility boosts premiums on the options we sell.
Moving Averages and Broader Trends
On the Dow Jones Industrial Average (DIA), the 20-period moving average (blue line) is crossing below the 50-period average, with price action dropping below the 100-day average (red line). For IWM, the 20-period moving average is close to crossing below the 100-day average, with the 200-day moving average coming into play.
This pattern – moving averages trending lower and bearish engulfing candles, suggests significant selling pressure ahead. Many institutional funds will start reducing positions as markets trade below the 200-day moving average, triggering risk management protocols.
Additional Observations
- Bitcoin (BTC) is showing a declining 20-period moving average that’s nearing a crossover with the 50-period average. This could lead to increased selling pressure. Meanwhile, looking bullish on silver, gold, and miners. Also interested in energy stocks like CVX as oil prices rise.
- Economic indicators like construction job openings, which dropped by 178,000 year-over-year in November, signal a weakening economy. Mortgage rates and bond market trends further highlight challenges ahead, as higher rates increase costs for businesses and consumers alike.
Final Thoughts
The charts remain the most reliable guide. By following the signals, volume trends, moving averages, and patterns like bearish engulfing candles – you eliminate emotional decision-making and focus on actionable strategies. Turn off the talking heads on the financial news (they are TV talent, not active traders) and focus on the charts for better forecasting.
As always, It’s encouraged that you to learn basic day trading strategies with low risk and stay tuned for more updates.
> Recommended: brokerage for trading > tastytrade.com.
> Recommended: order flow heatmap > bookmap.com.