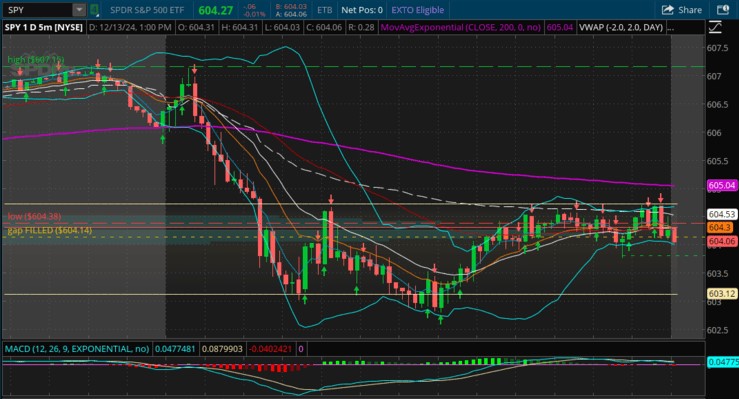
The MACD (Moving Average Convergence Divergence) indicator is a widely-used tool in day trading. It helps traders evaluate trends, spot momentum shifts, and make informed decisions. Understanding how this indicator works can give day traders a much-needed edge in fast-moving markets. Let’s break down its components, how it’s calculated, and strategies for using it effectively.
Understanding the MACD Indicator
The MACD is a trend-following momentum indicator that shows the relationship between two moving averages of a stock’s price. Its core purpose is identifying shifts in momentum, giving traders potential buy or sell signals.

Components of the MACD Indicator
The MACD has three primary components:
- MACD Line: This is the difference between the 12-day Exponential Moving Average (EMA) and the 26-day EMA. It’s the heart of the indicator.
- Signal Line: A 9-day EMA of the MACD line. It helps identify turning points and provides actionable signals.
- Histogram: Represents the difference between the MACD line and the signal line. The histogram visualizes momentum strength.
How the MACD Is Calculated
MACD’s calculation involves subtracting the 26-day EMA from the 12-day EMA. The formula looks like this:
MACD Line = 12-day EMA - 26-day EMA
Signal Line = 9-day EMA of the MACD Line
Histogram = MACD Line - Signal Line
These components are plotted together on a chart, producing a clear visual representation of price momentum changes.
Interpreting the MACD Indicator
Once you understand the basics, the next step is learning how to interpret the MACD. It’s all about reading the signals it provides accurately.
Bullish and Bearish Signals
A bullish signal occurs when the MACD line crosses above the signal line. This may indicate that an uptrend is beginning. Conversely, a bearish signal happens when the MACD line crosses below the signal line, suggesting a potential downtrend.
Traders often watch for these line crossings near the zero line (the point where the MACD shifts from positive to negative).
Divergence in MACD
Divergence occurs when the price moves in one direction, but the MACD moves in the opposite direction. This can be an early sign of potential trend reversals.
- Bullish Divergence: Price forms lower lows, but the MACD forms higher lows.
- Bearish Divergence: Price creates higher highs, while the MACD generates lower highs.
Divergence doesn’t guarantee reversals, but it’s a red flag to watch closely.
MACD Strategy for Day Trading

The MACD is versatile when it comes to building strategies. Let’s explore a specific approach tailored for day traders.
Setting Up the MACD for Day Trading
To optimize the MACD for day trading:
- Adjust Time frames: Use shorter time-frames like 5-minute or 15-minute charts.
- Fine-tune Settings: Stick to the standard 12, 26, and 9 EMA setup, but test minor adjustments to suit your trading style.
- Combine with Volume Indicators: Adding volume analysis can confirm signals.
Entry and Exit Points Using MACD
Entry Points: Look for bullish crossovers (MACD above the signal line) during an uptrend. Pay attention to the histogram expanding, which signals momentum.
Exit Points: Watch for bearish crossovers (MACD below the signal line). Shrinking histogram bars often confirm momentum fading.
For tight risk management, always set stop-loss orders below recent support levels.
Common Mistakes with MACD Indicator
While the MACD is powerful, it’s essential to avoid common errors that can undermine your trading strategy.
Over-reliance on MACD Signals
No indicator is foolproof. Relying solely on MACD signals can lead to poor decisions. It’s best combined with other technical indicators like RSI or trend-lines for validation.
- Be sure to check out the RSI indicator strategy and the Fibonacci Retracement Formula as they work in conjunction with the MACD.
Ignoring Market Conditions
The MACD performs best in trending markets. In choppy or sideways markets, its signals can be misleading. Always consider the broader market environment before taking action.
Conclusion
The MACD indicator is an indispensable tool for day traders. By understanding its components and mastering how to interpret the signals, traders can pinpoint trends and time their trades effectively. That said, always combine the MACD with other tools and adapt to market conditions.
Start practicing what you’ve learned here. Use the MACD to enhance your strategy and build confidence in your trading decisions. Success in day trading is all about preparation, discipline, and refining your approach.
> Recommended: brokerage for trading > tastytrade.com.
> Recommended: order flow heatmap > bookmap.com.


