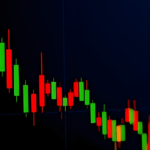
Fibonacci retracement is a popular tool among technical traders to identify potential support and resistance levels. It’s based on the key numbers identified by mathematician Leonardo Fibonacci, where the sequence (0, 1, 1, 2, 3, 5, 8, 13, 21, etc.) leads to ratios that are believed to predict levels of support or resistance. Here’s how it works…
- Fibonacci sequence definition (noun)
“a mathematical sequence composed of the Fibonacci numbers in order.”
source: merriam-webster.com
The Fibonacci Retracement Formula Explained
Here you will learn the definition of Fibonacci sequence, formula, analysis, algorithm, levels, and effects.
Key Fibonacci Ratios:
- 23.6%
- 38.2%
- 50% (not a true Fibonacci ratio but widely used)
- 61.8% (also known as the “golden ratio”)
- 78.6% (less commonly used)
How to Use Fibonacci Retracement
Identify the Trend:
- For an uptrend, you’d look for a significant high and low point (swing low to swing high).
- For a downtrend, you’d look for a significant low and high point (swing high to swing low).
Draw the Fibonacci Levels
- Using a charting tool, draw a line from the low to the high (for uptrends) or high to low (for downtrends).
- The tool will then automatically place horizontal lines at the Fibonacci levels (23.6%, 38.2%, etc.) between these points.
Interpret the Levels
Support and Resistance: These levels are where the price might find support during a retracement in an uptrend or resistance in a downtrend.
Traders watch these levels for potential entry points:
- In an uptrend, a retracement to one of these levels could be where buyers enter, expecting the trend to continue.
- In a downtrend, a retracement up to these levels might be where sellers enter, anticipating the price to fall back.
Trading Strategy:
- Entry Points: If the price retraces to one of these levels and starts to bounce back, it might be an entry point for a trade in the direction of the main trend.
- Stop Loss: Place stop losses just below (in an uptrend) or above (in a downtrend) the Fibonacci level to manage risk if the price breaks through the retracement level.
- Take Profit: Higher Fibonacci levels can also be used to set take-profit levels, although other methods like moving to break-even or using a trailing stop can also be employed.
Real Stock Example:
Example: Apple Inc. ($AAPL) in 2020
- After a significant drop in March 2020, Apple’s stock began a strong recovery.
- Traders drawing Fibonacci retracement from the low on March 23 ($53.15) to the high on September 1 ($137.98) would find:
- The 38.2% retracement level was around $105.37, which acted as support in mid-October when the stock pulled back.
- The 50% level was at $95.56, which also showed support in late September.
Action:
Traders might have seen these levels as buying opportunities, especially if other indicators confirmed the support.
Considerations:
- Not a Standalone Tool: Use Fibonacci retracement in conjunction with other indicators like RSI, moving averages, or trend lines for confirmation.
- Market Psychology: These levels work because many traders watch them, creating self-fulfilling prophecies at times.
- Adjustments: Sometimes, traders might adjust the levels slightly based on historical price action or current market volatility.
- Time Frame: The effectiveness can vary with the time frame used; daily charts might show different levels than hourly or weekly charts.
Fibonacci retracement levels help traders identify potential areas where the price might pause or reverse, but they are not foolproof. Market conditions, news, and unexpected events can override these technical levels. Always combine Fibonacci with other forms of analysis for the best results. See this post on Fibonacci trading strategies.
> Recommended: brokerage for trading > tastytrade.com.
> Recommended: order flow heatmap > bookmap.com.


