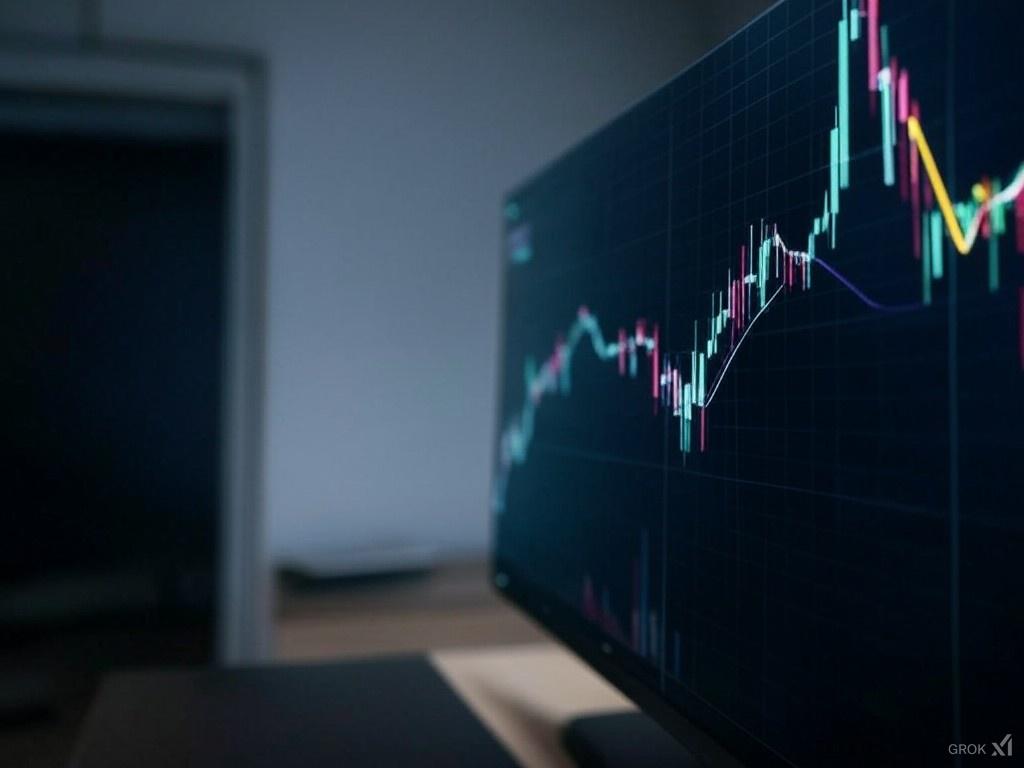
Candlestick patterns are powerful tools for traders. They hold vital clues about market trends, sentiment, and potential price movements. By learning these patterns, traders can anticipate market behavior and make better decisions. Whether you’re a seasoned trader or just starting, understanding candlestick patterns can give you an edge in technical analysis.
Understanding Candlestick Patterns

Candlestick patterns are visual representations of price movements within a specific time frame. They show the opening, closing, high, and low prices of a market. These patterns are used to forecast trends, identify potential reversals, and understand the battle between buyers and sellers.
Components of a Candlestick
Every candlestick has three main parts: the body, the upper wick, and the lower wick.
- The Body: This is the thick portion of the candlestick. It represents the range between the opening and closing prices. A green or white body shows a price increase, while a red or black body indicates a decrease.
- The Upper Wick (or Shadow): This is the thin line extending above the body. It shows the highest price reached during the trading session.
- The Lower Wick (or Shadow): This line extends below the body, indicating the lowest price during the session.
Together, these components create a snapshot of market activity within a specific period.
Bullish vs. Bearish Candlesticks
Candlesticks come in two types: bullish and bearish.
- Bullish Candlesticks: These have a green or white body. They show that the closing price is higher than the opening price, signaling buying pressure.
- Bearish Candlesticks: These have a red or black body. They indicate that the closing price is lower than the opening price, suggesting selling pressure.
The color and structure of a candlestick provide critical information about market sentiment.

Popular Candlestick Patterns
Some candlestick patterns are more reliable and widely used than others. Below, we’ll explore a few essential ones that every trader should know.
Hammer and Hanging Man
These single-candlestick patterns look similar but signify different things depending on their context.
- Hammer: Appears after a downtrend and has a small body with a long lower wick. It signals a potential reversal to the upside.
- Hanging Man: Found after an uptrend, it has the same structure as the hammer but suggests a reversal to the downside.
Both patterns reflect a tug-of-war between buyers and sellers.
Doji Patterns
A Doji occurs when the opening and closing prices are nearly identical, resulting in a candlestick with a very small body. It indicates market indecision and often acts as a precursor to major price movements.
Common types of Doji include
- Neutral Doji: Equal upper and lower wicks, reflecting balanced forces.
- Long-Legged Doji: Extended wicks on both sides, showing extreme volatility.
- Dragonfly and Gravestone Doji: These have either no upper wick or no lower wick, pointing to potential trend reversals.
Engulfing Patterns
Involve two candlesticks where one “engulfs” the other.
- Bullish Engulfing: A green candlestick entirely engulfs the previous red one. This pattern suggests a potential price increase.
- Bearish Engulfing: A red candlestick fully engulfs the preceding green one, signaling a possible decline in price.
These engulfing patterns often confirm strong shifts in market sentiment.
To see more candlestick patterns examples, visit out Pinterest board.

Using Candlestick Patterns in Trading
While visually simple, candlestick patterns can be strategic tools for traders. Here’s how they can enhance your trading approach.
Identifying Market Trends
Candlestick patterns help traders spot bullish or bearish trends early. Patterns like the hammer or engulfing candlesticks are often seen at the beginning of new trends, giving traders an opportunity to ride the wave.
For example, a bullish pattern in an uptrend signals continued momentum, while a bearish formation in a downtrend confirms weakness.
Setting Entry and Exit Points
Candlestick formations are invaluable for timing trades. They provide clear signals for when to enter or exit positions.
- Entry Points: Bullish patterns like a hammer or bullish engulfing indicate strong buying opportunities.
- Exit Points: Bearish patterns, such as a hanging man or bearish engulfing, warn of potential declines, signaling it’s time to sell.
These patterns reduce guesswork and provide traders with structured strategies.

Limitations of Candlestick Patterns
While candlestick patterns are helpful, they’re not foolproof. Traders should be aware of their shortcomings to avoid costly mistakes.
False Signals
Not all candlestick patterns indicate legitimate price movements. Market noise and random fluctuations can create patterns that don’t lead to expected outcomes. For instance, a Doji may occur without any significant market change, leading to poor decisions if relied on too heavily.
Need for Confirmation Indicators
Successful trading often requires more than just candlestick patterns. Combining these patterns with other tools like moving averages, RSI, or volume indicators significantly improves accuracy.
For example, a bullish candlestick confirmed by high trading volume is far more reliable than one without supporting evidence.
Conclusion
Candlestick formation patterns are essential for understanding market behavior. They provide insights into trends, reversals, and overall market sentiment. Patterns like the hammer, Doji, and engulfing formations can guide traders in setting strategic trades.
However, candlestick patterns aren’t a magic solution. They should be paired with other technical analysis tools to make well-rounded decisions. As with any skill, practice is key. The more you analyze and use candlestick patterns, the better equipped you’ll be to navigate the markets confidently.
> Recommended: brokerage for trading > tastytrade.com.
> Recommended: order flow heatmap > bookmap.com.


